- Demo
-
Scientific results
Home / Introduction: 1. About RMT 2. Monitoring 3. Demo
|
|
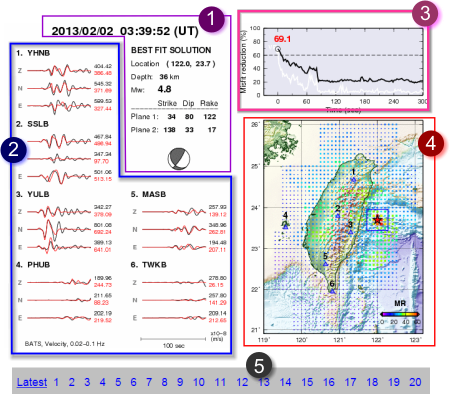
1 Best fit solution in real-time, including time, location, moment magnitude and focal mechanism. 2 Comparison between the data (black lines) and the synthetic waveforms (red lines). 3 The continuous misfit reduction (MR) of the best fit solution. The variance reduction (VR) is also presented in the background and shown as thin white line. 4 The MR map which presents the largest MR values in the monitoring area. The epicenter of the detected event is shown by a red open star. 5 The events which have MR > 60 are temporarily listed in the lower panel. |
|
► An earthquake has been detected when: (1) the MR is larger than the threshold (MR = 60), and (2) a peak MR appears (at t sec) that is no larger than the MR found previously and after 20 seconds (t +- 20 sec). The epicenter of the detected event is shown by a red-solid star and highlighted with a blue-open square on the MR map. |
|